From a designer’s perspective, one of the more powerful features of Flash is the scale9Grid property. Basically, you take a display object’s graphics, and you divide it into nine regions. When you want to scale the display object, the four corner regions do not scale. The top and bottom regions scale horizontally only. The left and right regions scale vertically only. And the center region scales in both directions. This technique to scaling different parts of a shape is sometimes also called 9-slice scaling.
If it’s not clear, hopefully the illustration below may help. The white lines between each region represent the scale9Grid. The arrows indicate the direction(s) that each particular region scales.
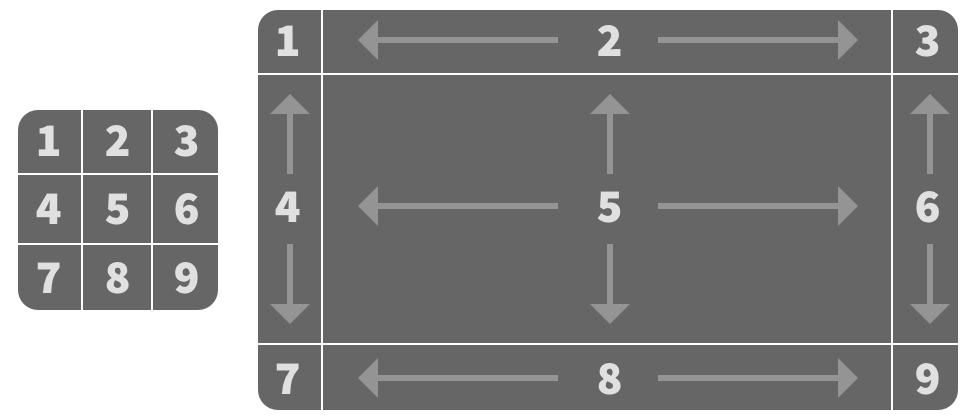
Using scale9Grid allows shapes, especially rectangles with rounded corners, to resize without distorting their corners, and minimizing distortion to one direction on each of the edges. The corner radius will remain the same no matter how much larger you scale a Sprite that uses scale9Grid. The edges will preserve the same thickness, but can get longer in the other direction. The center is intended to stretch in both directions.
Without scale9Grid, the same graphics would scale like the next illustration below:
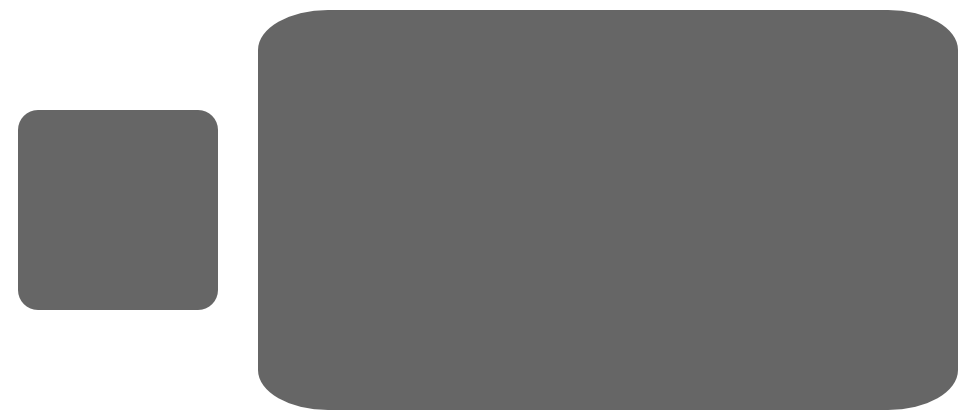
Notice the corner radius has increased, but it has also increased differently in the horizontal and vertical directions. The scaleX value increased more than the scaleY value, in this case.
Obviously, this is a particularly useful feature to include in OpenFL, and my focus for the last month has been on implementing its behavior correctly, so that we can match how Flash’s scale9Grid works. There are actually different possible ways to approach the implementation of scale9Grid, and I learned a lot about how exactly Flash does it in the process. Even though I started using Flash over 20 years ago, it turns out that my mental concept of its scale9Grid behavior was close, but it wasn’t actually completely accurate.
If you’re not familiar, OpenFL is an implementation of the APIs available in Adobe Flash Player (and Adobe AIR) using the Haxe programming language. Projects built with Haxe can be cross-compiled to JavaScript, C++, and many other targets — making it available on the web, desktop apps, mobile apps, game consoles, and more. Lime is a dependency of OpenFL, developed by the same team, and it exposes various native C++ libraries to Haxe (such as SDL, FreeType, and various audio and image format decoders). As I contributor to both projects, I occasionally write these devlogs to share an early look at new features that I’ve implemented, and to spread technical knowledge about how things work.
The quick and dirty approach to scale9Grid
The quickest way to implement scale9Grid would be to treat the display object as if the cacheAsBitmap property were enabled, and then to slice up the BitmapData into nine regions, and render and scale each of those regions as independent bitmaps.
This approach works pretty well when using beginFill() for solid colors, and if you ensure that strokes are used only as a border. However, if you use beginGradientFill() or beginBitmapFill(), if strokes don’t follow right angles in non-corner regions (or if they appear in the center region), or if the display object has children, rendering issues start to creep in.
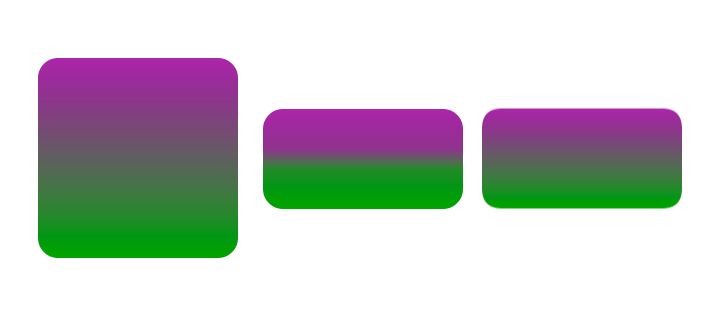
The following illustration shows how drawRoundRect() with beginGradientFill() behaves with each approach. The shape on the left is the original. The one in the center shows how the gradient is rendered when using the simple bitmap slicing approach. The one on the right is how Flash renders the gradient. You can see that the center one incorrectly distributes the gradient, and the beginning and end colors are too strongly represented. The right one distributes the colors evenly.
The quick and dirty BitmapData slicing technique is better than nothing, of course. I’d rather have it than no ability to use scale9Grid at all, but matching the behavior of Flash will definitely give us better results.
How Flash’s scale9Grid works
The previously described approach basically post-processed a rendered display object after its Graphics drawing commands, such as moveTo(), lineTo(), or curveTo(), were already executed. However, what if the (x, y) positions specified in the Graphics drawing commands could be modified as they are executed instead? This would improve the rendering quality, and it would allow for more natural gradients and things like consistently tiled bitmap fills.
How to do it? Well, it’s best to break it down and calculate the adjusted x and y positions separately. We’ll be able to call the same function for both directions, and the only difference is the arguments that we pass into the function. Here’s a representation of how a lineTo() command is processed by OpenFL when rendering using the HTML Canvas API.
var lineToCommand = data.readLineTo();
var x = lineToCommand.x;
var y = lineToCommand.y;
if (scale9Grid != null)
{
	x = toScale9GridPosition(x, scale9Grid.x, scale9Grid.width, originalWidth, scaleX);
	y = toScale9GridPosition(y, scale9Grid.y, scale9Grid.height, originalHeight, scaleY);
}
context2d.lineTo(x, y);
It’s a little more complicated in the real code because scale9Grid is ignored in cases where the object is rotated or skewed, but this is pretty close to how OpenFL handles it.
The magic happens in that toScale9GridPosition() function that we use above to adjust both the x and y positions. A simplified representation of that function appears below.
function toScale9Position(pos:Float, gridStart:Float, gridCenter:Float, unscaledSize:Float, scale:Float):Float
{
	// scale9Grid stores two of the three regions in each direction,
	// so we need to calculate the third region
	var gridEnd = unscaledSize - gridCenter - gridStart;

	// what's the new total width or height after accounting for
	// scaleX or scaleY?
	var scaledSize = unscaledSize * scale;

	// if the start and end regions are unscaled, what's the new
	// size of the center region?
	var scaledCenter = scaledSize - gridStart - gridEnd;
First, we need to calculate a few values based on our inputs.
scale9Grid represents a 3×3 grid, but the openfl.geom.Rectangle type stores only the data for a 2×2 grid. We need to calculate the final region in each direction based on the original, unscaled width or height of the graphics.
Then, we need to calculate the rendered width or height by multiplying the original, unscaled width or height of the graphics either by scaleX or scaleY.
Finally, we need to determine the rendered width or height of the center region, which is based on the scaled width or height, but subtracting the first and third grid regions. These regions represent the corners, which we don’t want to scale.
From there, we can figure out where the pos parameter falls within the three regions. The first region is easy. Just check if pos is less than the value of scale9Grid.x or scale9Grid.y (represented here as gridStart).
if (pos <= gridStart)
{
	return pos;
}
Then, we’ll check if pos falls within the third region.
if (pos >= (gridStart + gridCenter))
{
	return gridStart + scaledCenter + (pos - gridStart - gridCenter);
}
After scaling, the third region starts at (gridStart + scaledCenter). To determine where pos falls within the third region, we need to subtract both gridStart and gridCenter from pos.
Finally, if pos does not fall within the first or third region, we need to figure out where it falls within the center region.
return gridStart + scaledCenter * (pos - gridStart) / gridCenter;The center region starts at gridStart. To determine where pos falls within the original, unscaled center region, we need to subtract gridStart from pos. However, since the center region is scaled, we need to divide by either scale9Grid.width or scale9Grid.height (represented here as gridCenter) and then multiply by scaledCenter.
I left out some edge cases, but that’s basically how to adjust the points to account for scale9Grid. The first edge case is when scaleX or scaleY is zero or a negative value. In that case, the graphics simply aren’t rendered, and the function returns 0.0. The second edge case is when the graphics are scaled down so small that the center region size would be a negative value. In that case, the center region size is treated as 0.0, and then, the corners need to be scaled down! Normally, we don’t scale the corners at all, but when the size is too small, we have no choice (otherwise, they would overlap). In that case, we introduce the value (gridStart + gridEnd + scaledCenter) / (gridStart + gridEnd) as an additional scale multiplier for the first and third regions.
Handling fills with scale9Grid
Adjusting the positions solves rendering strokes and simple usage of beginFill(). However, more complex fills, like gradients and bitmaps, need to be adjusted too.
For gradients, you typically use the createGradientBox() method on openfl.geom.Matrix to specify the region of the graphics that the gradient should fill. That box is based on the original, unscaled width and height of the graphics. For a simple linear gradient, we use two openfl.geom.Point instances to represent where the gradient starts and ends. After applying that gradient box Matrix, the x and y properties of the Point instances basically map to the same coordinate space you would use for moveTo() or lineTo(). Maybe you’re seeing where this is going already….
point = new Point(-819.2, 0);
point2 = new Point(819.2, 0);
point = matrix.transformPoint(point);
point2 = matrix.transformPoint(point2);
if (scale9Grid != null)
{
	point.x = toScale9Position(point.x, scale9Grid.x, scale9Grid.width, originalWidth, scaleX);
	point.y = toScale9Position(point.y, scale9Grid.y, scale9Grid.height, originalHeight, scaleY);
	point2.x = toScale9Position(point2.x, scale9Grid.x, scale9Grid.width, originalWidth, scaleX);
	point2.y = toScale9Position(point2.y, scale9Grid.y, scale9Grid.height, originalHeight, scaleY);
}
For gradients, we can use that same toScale9Position() function described above to adjust the x and y properties of those Point instances! Now, we can draw an evenly distributed gradient between those points, instead of slicing through the gradient in the middle somewhere.
Side note: Are you wondering what’s up with the -819.2 and 819.2 values? I’m not completely sure either, but I have a some ideas about where it came from. We don’t really use them much in OpenFL, but Flash has a unit of measure called a twip. In Flash, a twip is defined as 1/20th of a pixel. If we multiply 819.2 by 20, we get 16384. That’s an interesting value because, if you know your powers of 2, 16384 is the result of 2^14. Computers handle everything in binary, so this value may have been chosen as an optimization based on how something (I’m not sure what exactly) is stored in memory. Anyway, let’s get back to
scale9Grid….
Bitmap fills are a little more complicated. Gradient fills always have a defined start and end point, and adjusting the gradient is based on which regions of the scale9Grid that those points fall into. With a bitmap fill, we mainly have the width and height, which provides an ending position, but not really a starting position, so we can’t use toScale9Position() in the same way that we did with the gradient box Matrix. The bitmap can be drawn with a Matrix too, but it’s purely a transformation, and it doesn’t define a box to work with, like you’d get with a gradient’s Matrix.
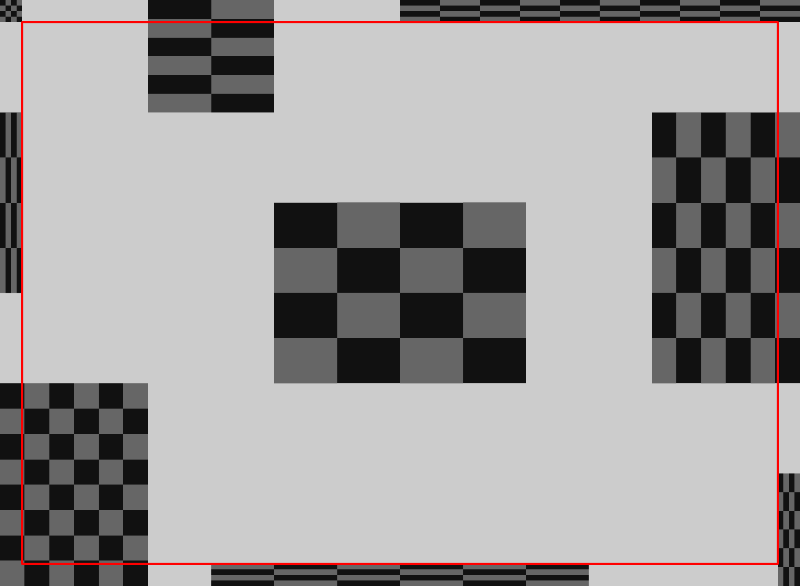
To better understand how scaling the bitmap works, I created a little demo app in Flash. I used beginBitmapFill() (with tiling) and drawRect() to test how scaling works when a rectangle is fully contained within the top-left corner, the left region, the bottom region, or the center region. Then, I drew some more rectangles that spanned two or more regions. I included one spanning the top region and the top-right corner, another spanning the top region and the center region, and one spanning the right region and the center region. One final rectangle spanned four regions around the bottom-left corner, including the left region, the bottom region, and the center region. See the screenshot below for what I mean:
Going in, I knew from experience that if your bitmap fill was fully contained within a corner, it wouldn’t be scaled. I also knew that each of the four sides scales in one direction only. Finally, the center scales in both directions. Basically, it’s normal scale9Grid rules, as long as you keep the bitmap fill inside a single region.
However, I wasn’t quite sure that I understood what would happen when a bitmap fill spanned multiple regions. I remembered that if I spanned all nine regions with a single bitmap fill, it would scale in both directions too. I just wasn’t sure by how much. Would it inherit the scale factor of the center region? Would it take some kind of average of each region that it spanned? Something else?
Looking at the screenshot above, it’s easy to rule out the center region’s scale factor taking precedence. The fill in the bottom-left corner that spans four regions includes the center region, but it is clearly scaled differently than the fill that is fully contained within the center region. The boxes in the grid would be the same size in both fills, if they were scaled the same.
Is it some kind of average? No, not that either. I figured it out by playing with my demo so that the Sprite resized based on MouseEvent.MOUSE_MOVE. I watched how the grid boxes would grow and shrink. The number of grid boxes in either the horizontal or vertical direction never changed in Flash. If, at the original width and height of the Sprite, my bitmap fill had four boxes in the horizontal direction and three boxes in the vertical direction, it would always have four boxes and three boxes no matter how big or small I resized the Sprite. Only the boxes would scale, but the same number of boxes would always be displayed (including the same portion of partial boxes too).
With that in mind, we can conclude that the starting and ending points of the fill are actually based on the points of the drawing commands, like moveTo() and lineTo(). In other words, we’ve already used toScale9Position() when we were figuring out those positions. We don’t need to call it again for the bitmap fill. Instead, we need to use the results of those existing calculations to somehow figure out the scale of the fill.
Basically, what I ended up doing was keeping track of the minimum and maximum x and y positions used by all drawing commands between beginBitmapFill() and endFill() (with one additional check at the end, in case a final call to endFill() was omitted, which is allowed). I saved the minimum and maximum of both the original x and y values, and the scaled x and y values returned by toScale9Position().
Then, the bitmap scale is basically calculated like this:
var fillScaleX = (scaledMaxX - scaledMinX) / (unscaledMaxX - unscaledMinX);
var fillScaleY = (scaledMaxY - scaledMinY) / (unscaledMaxY - unscaledMinY);
Note: If maximum and minimum values are equal, we need to avoid dividing by zero, so it returns 1.0 when that special case is encountered.
Scaling isn’t quite enough to match Flash’s behavior in OpenFL. We also need to translate the position of the bitmap fill just a little so that the fill starts relative to scaledMinX and scaledMinY instead of unscaledMinX and unscaledMinY.
var fillTx = ((scaledMinX % (bitmapData.width * fillScaleX)) / fillScaleX)
	- (unscaledMinX % bitmapData.width);
var fillTy = ((scaledMinY % (bitmapData.height * fillScaleY)) / fillScaleY)
	- (unscaledMinY % bitmapData.height);
That’s basically the gist of how scale9Grid works in Flash, and now, OpenFL. I didn’t cover shape drawing commands, like drawRect(), drawCircle(), and others like that mainly because it ends up being almost exactly the same as basic commands like moveTo() and lineTo(). Shapes simply have more points, and each of those points is adjusted through toScale9Position() the same way.
Where can I find the code?
If you want to try out the new The new scale9Grid implementation was released in OpenFL 9.5.0 in November 2025!scale9Grid implementation in OpenFL, you’ll need to check out OpenFL’s 9.5.0-dev branch on Github, or you can download the openfl-haxelib artifact from a successful Github Actions OpenFL 9.5.0-dev nightly build. Of course, it’s important to remember that nightly builds are not necessarily ready for a stable release on Haxelib yet, so use at your own risk in production. You may encounter some bugs, but we’d love any feedback that you can give.
P.S. If you love reading my OpenFL and Lime devlogs, or if you benefit from any of my contributions to OpenFL in general (coding, documentation, answering forum/Discord questions), please consider either a one-time donation or a monthly recurring donation as a token of appreciation through my GitHub Sponsors, Liberapay, or Ko-Fi pages. Thank you!